Flowsheet Viewer
Note
The flowsheet viewer requires the use of JupyterLab.
Overview
Flowsheets may be serialized to “.idaes.vis” files which, in conjunction with the flowsheet viewer, produce interactive visual representations of flowsheets. The resultant flowsheet diagrams can be rearranged and saved.
Instructions
- Ensure that the latest IDAES is installed.
- Install JupyterLab. If you are not using Conda environments, use the pip install instructions.
Installation
From your terminal, call the following commands to build and install the extension:
    cd <repository>/ui/modelvis/idaes-model-vis
npm install # takes a few minutes
npm run build
jupyter labextension link . # takes a few minutes
Usage
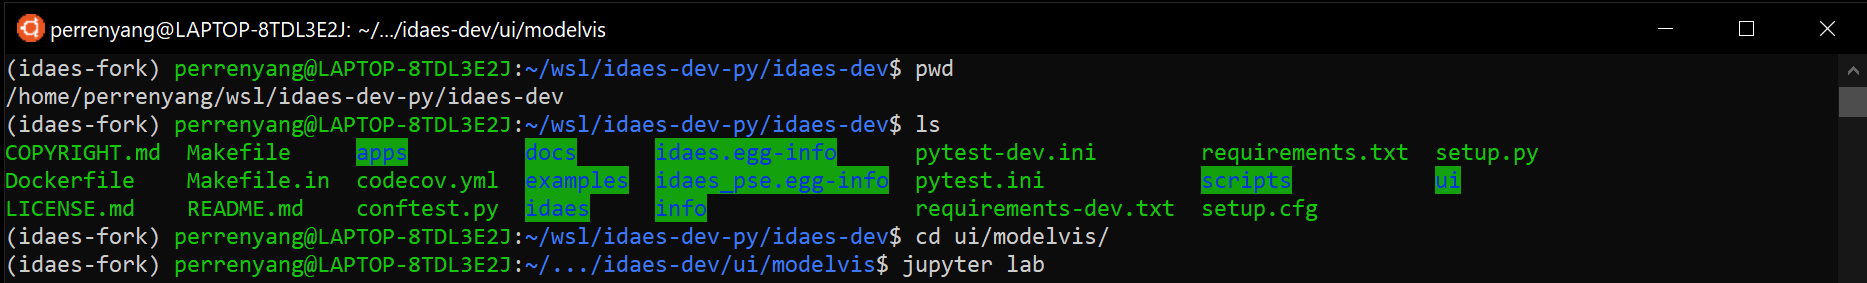
- Launch JupyterLab (run
jupyter labfrom a folder you wish to work out of).
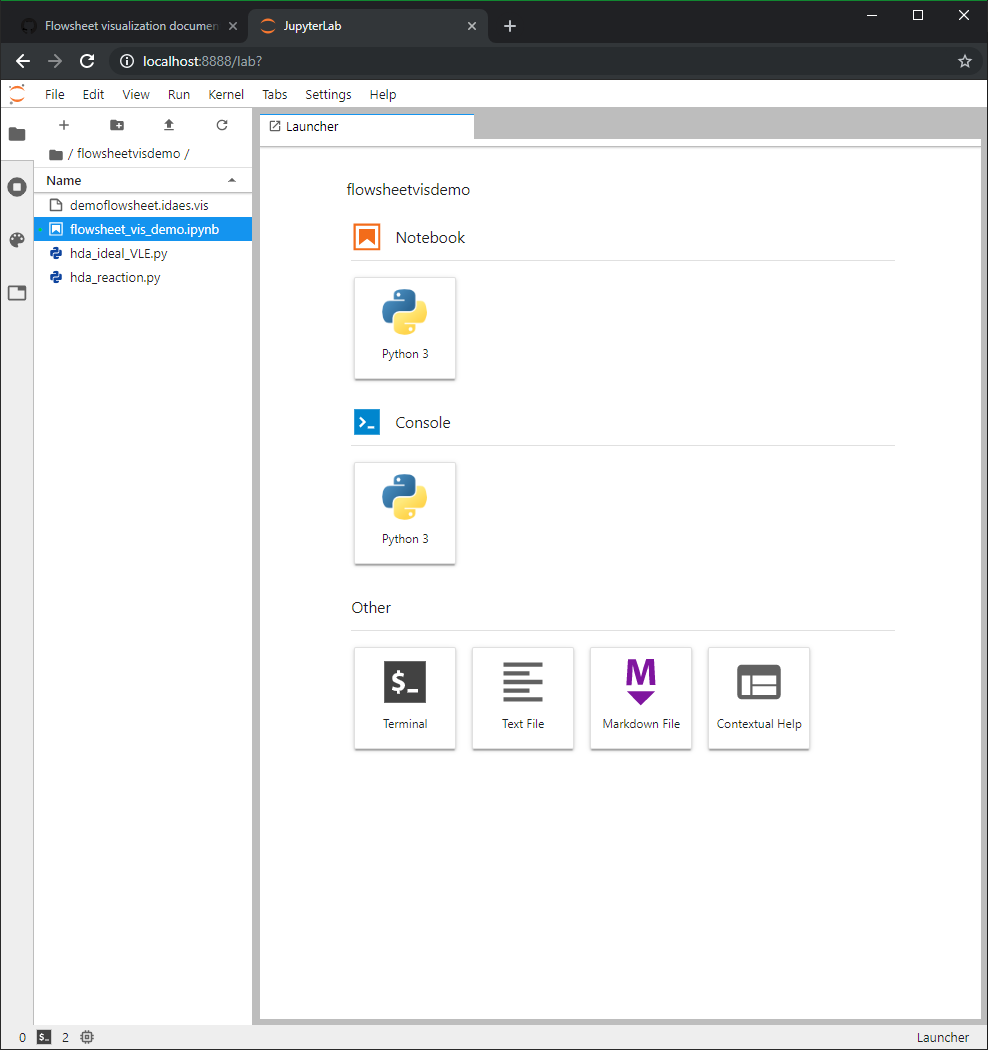
- Create a new Python 3 notebook from the JupyterLab Launcher, or select a preexisting notebook from the directory navigation pane on the left. An example (depicted) is located in idaes-pse/ui/modelvis/flowsheetdemo.
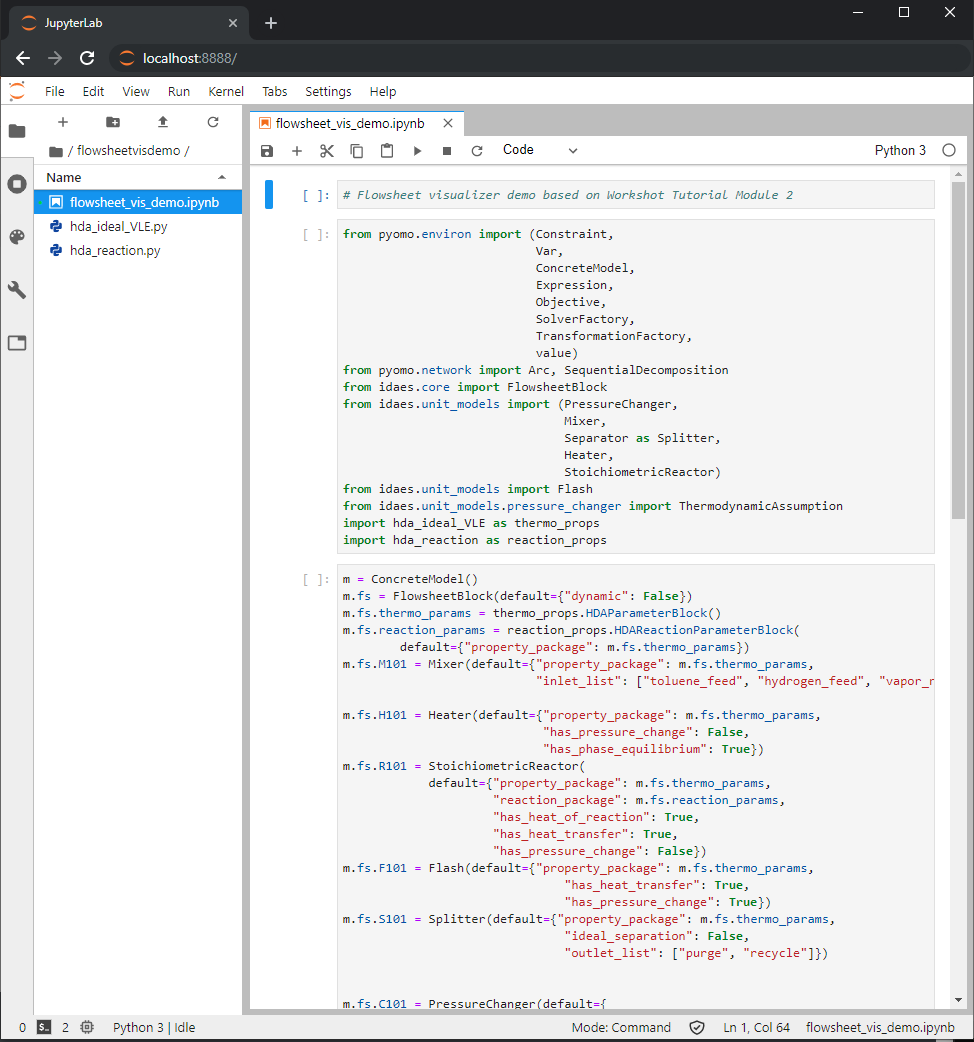
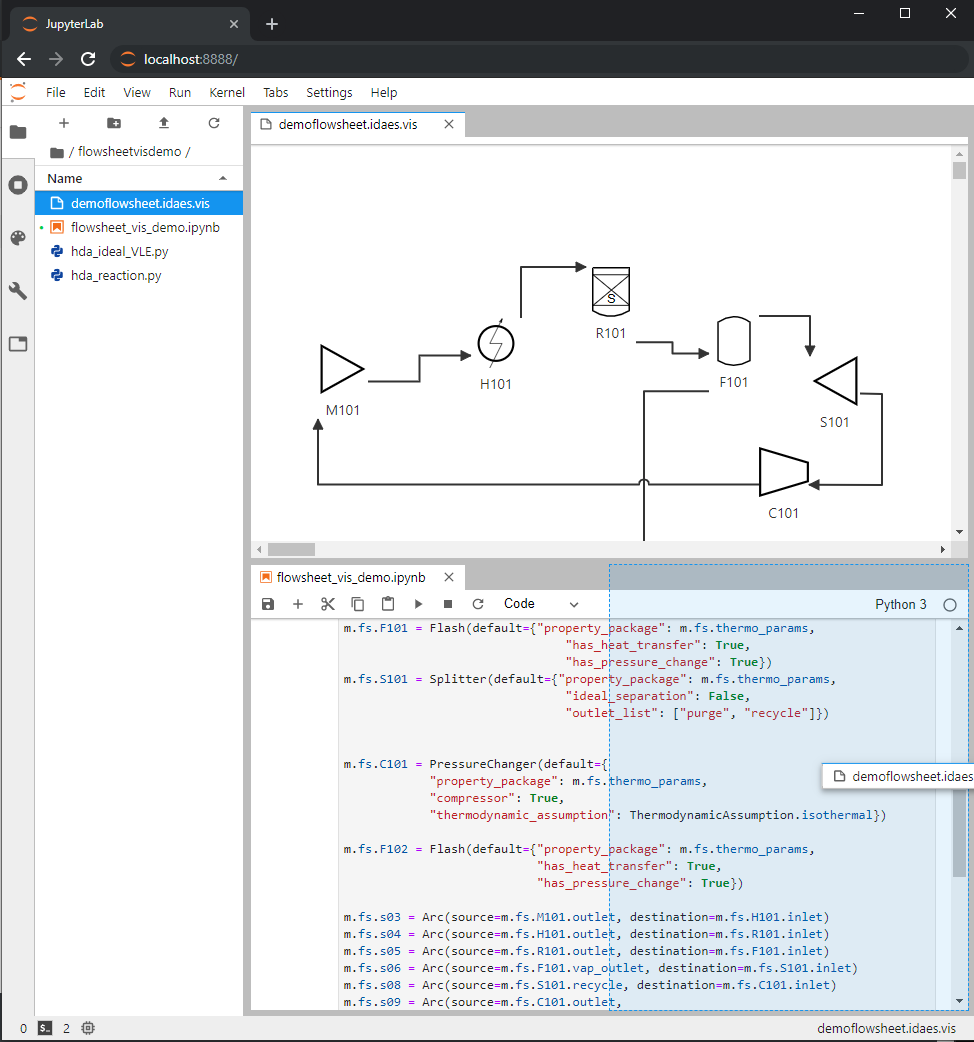
In the notebook, construct a flowsheet as usual (add unit models, set connections, etc.).
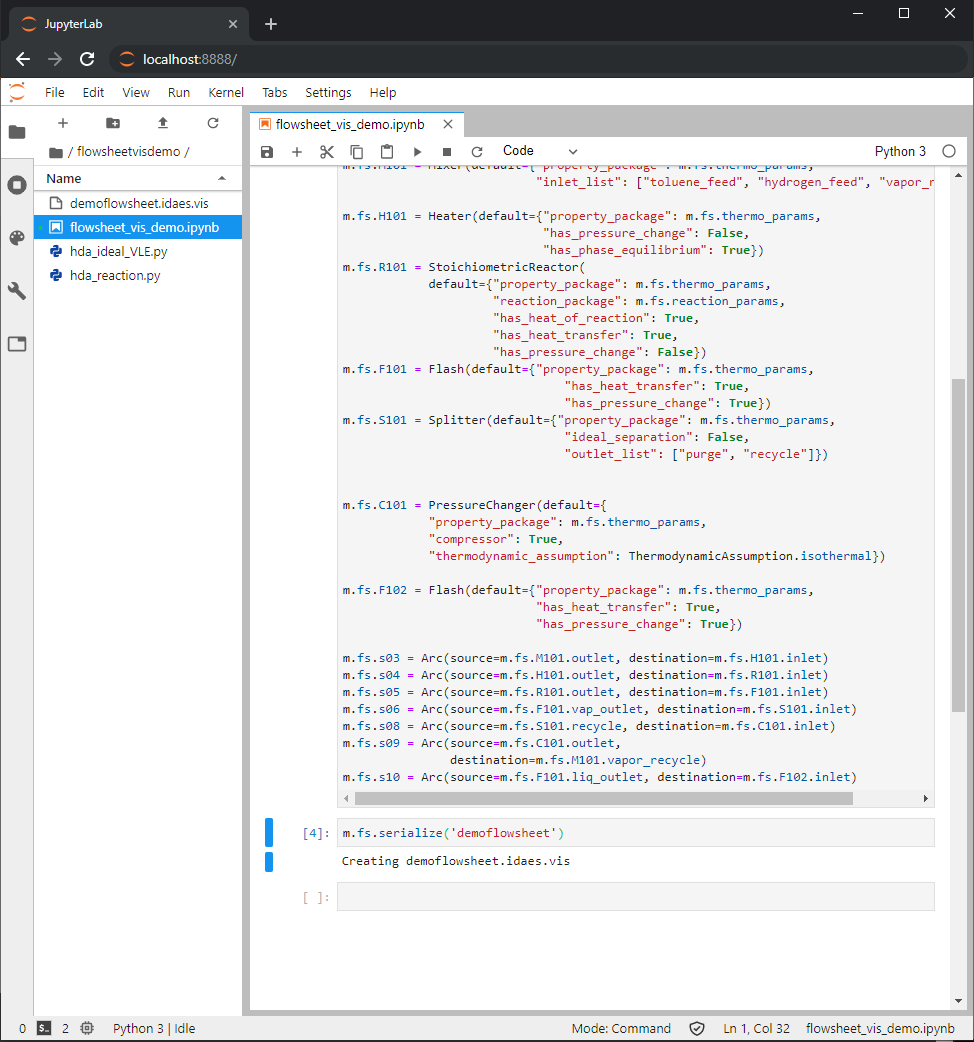
Run the .serialize() method from the flowsheet, as below:
m.fs.serialize('myflowsheetname')
A
.idaes.visfile should be created with the chosen filename (e.g.myflowsheetname.idaes.vis), and become visible in the JupyterLab file browser. If there is an existing file with the same name, you must either choose a different filename or add the additional optional argumentoverwrite=True(in which case the file will be overwritten).
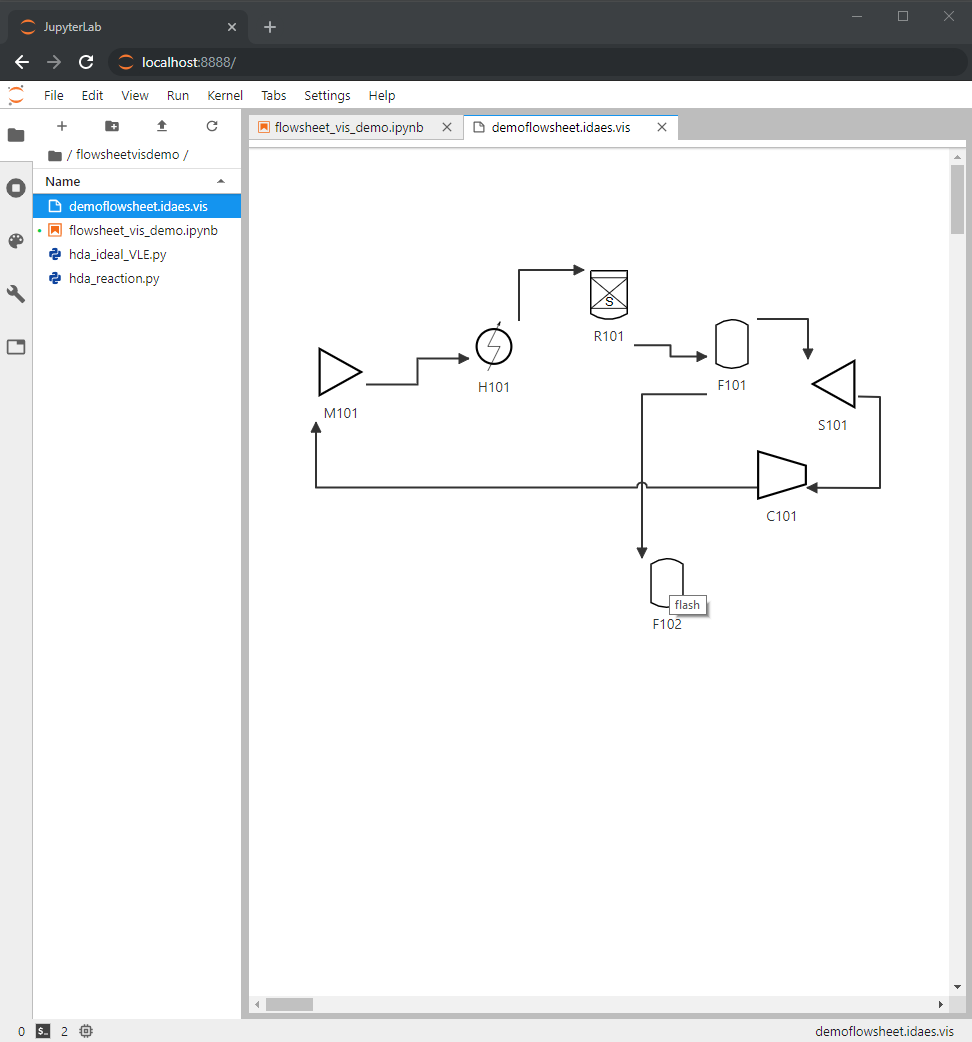
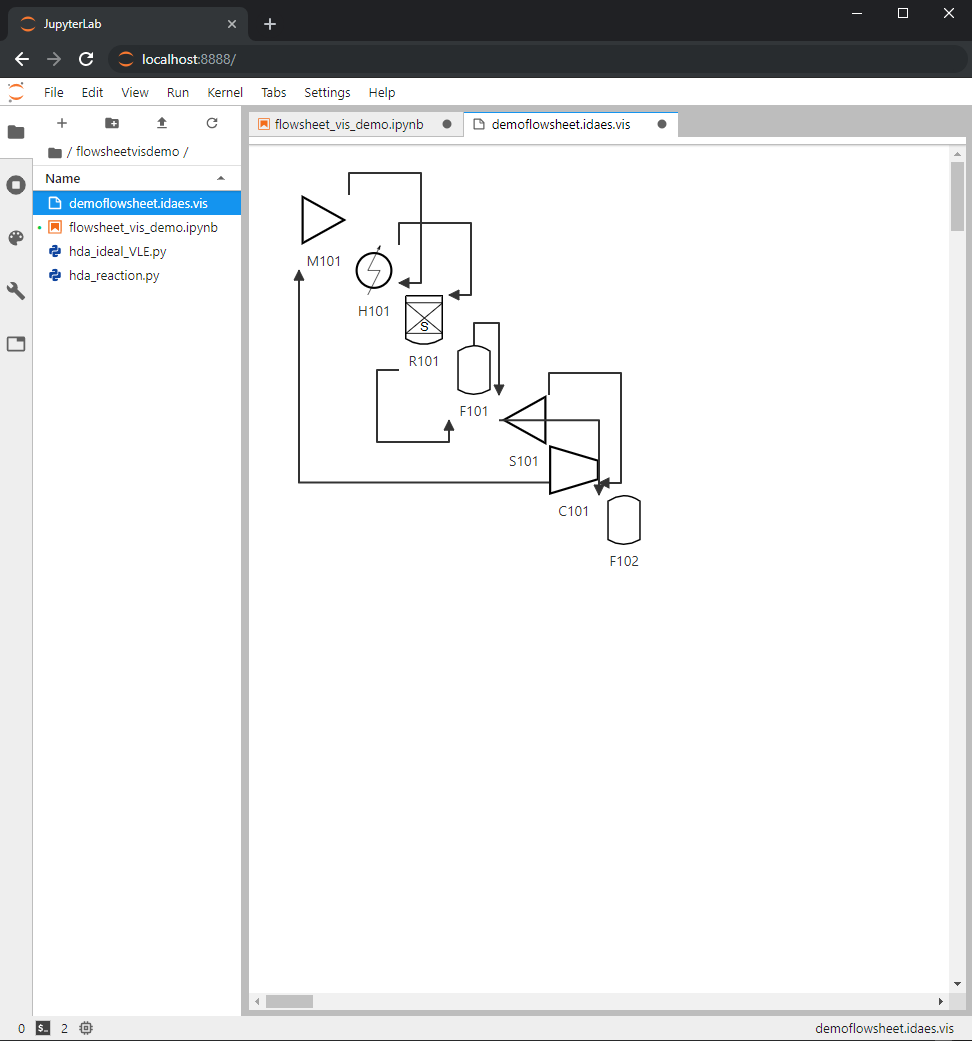
- Open the created
.idaes.visfile in JupyterLab. A tab should open and display a graph representation of the serialized flowsheet; the components are tiled diagonally by default, and can be rearranged to your liking.
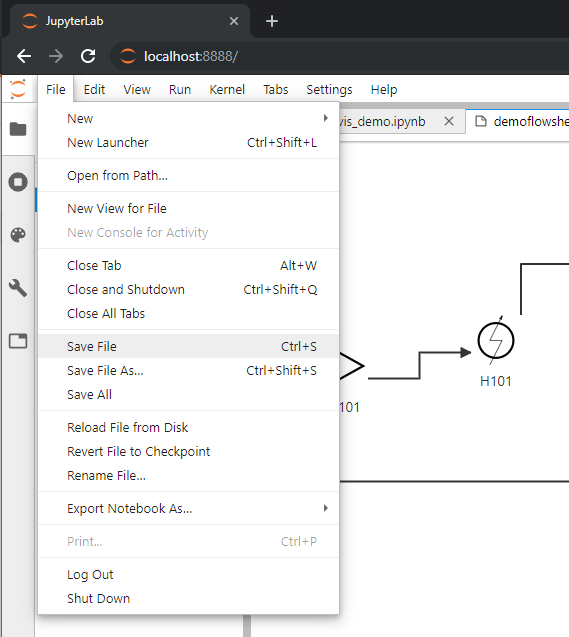
- The layout of the graph can be saved into the serialized file by using JupyterLab’s
File->Savemenu item (or the equivalent hotkey Ctrl+s/Command+s). Autosaving can also be configured by using JupyterLab’sSettings->Advanced Settings Editoroption underDocument Manager.
Miscellany
- Unit model icons can be rotated by right-clicking on the icon.
- Connections paths between unit models can be moved by clicking on the link, then dragging the link vertex that appears. Double-click the vertex to remove it.
- JupyterLab tabs can be rearranged by clicking and dragging the top of the tab, and resized by dragging the borders.