Visualization
Warning
The visualization library is still in active development and we hope to improve on it in future releases. Please use its functionality at your own discretion.
Overview
The Flowsheet Visualizer is a service that starts a flask server and displays a webpage with the current model’s unit models as icons and the arcs as links between the icons.
The icons are fully movable as are the links and link labels.
Installation instructions
Usage
- Create a flowsheet in a Jupyter Notebook. For the purpose of these instructions the model will be m and the flowsheet will be m.fs
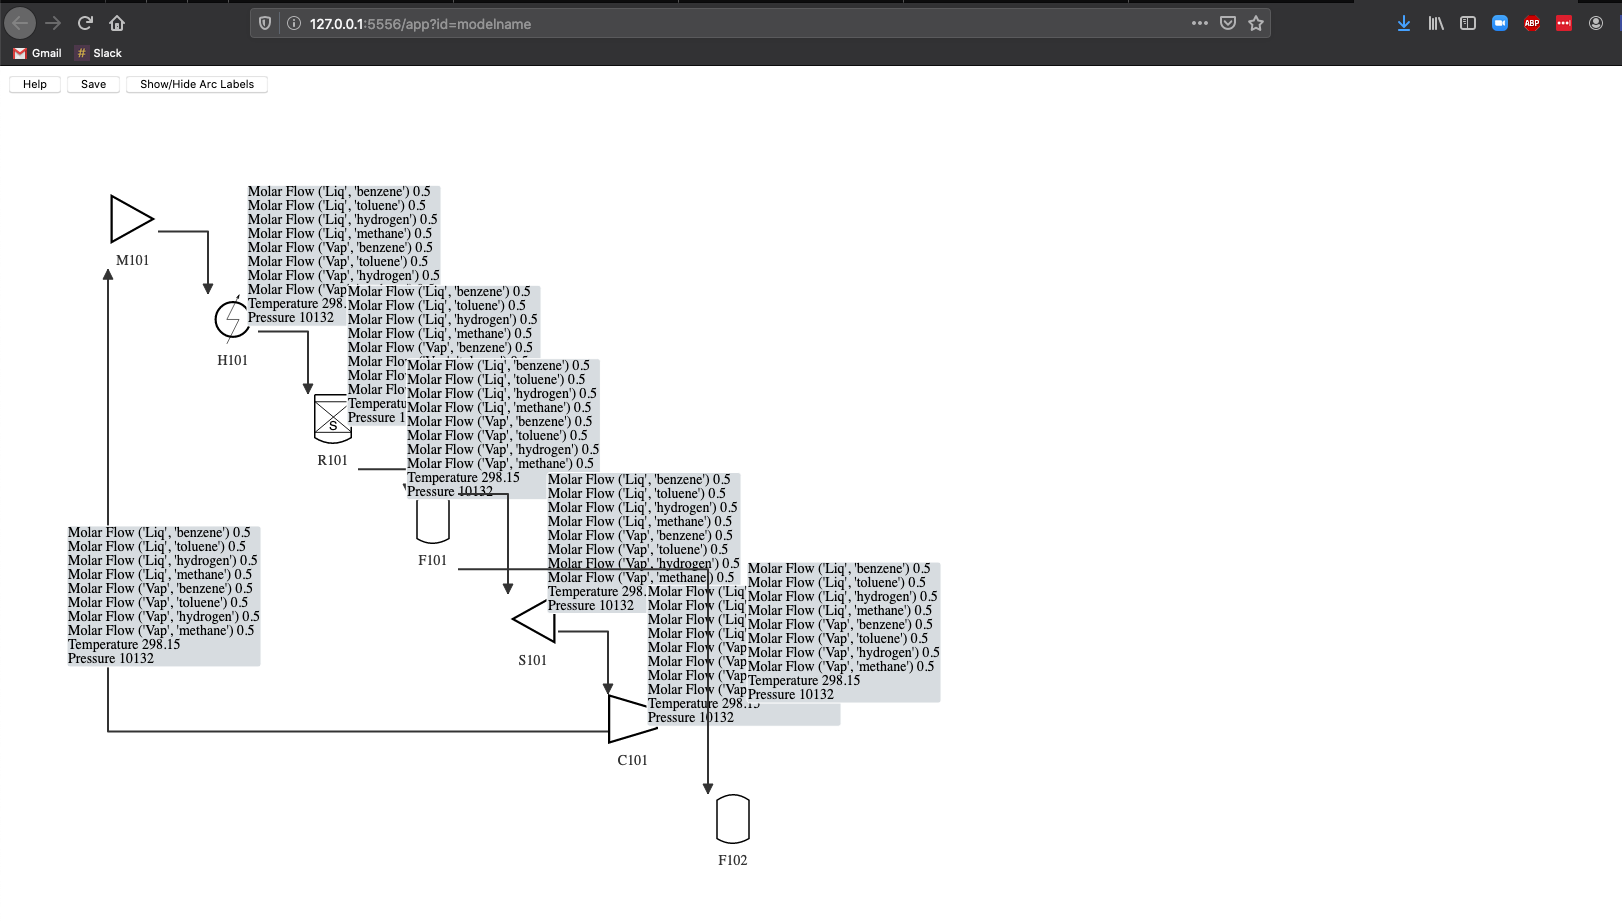
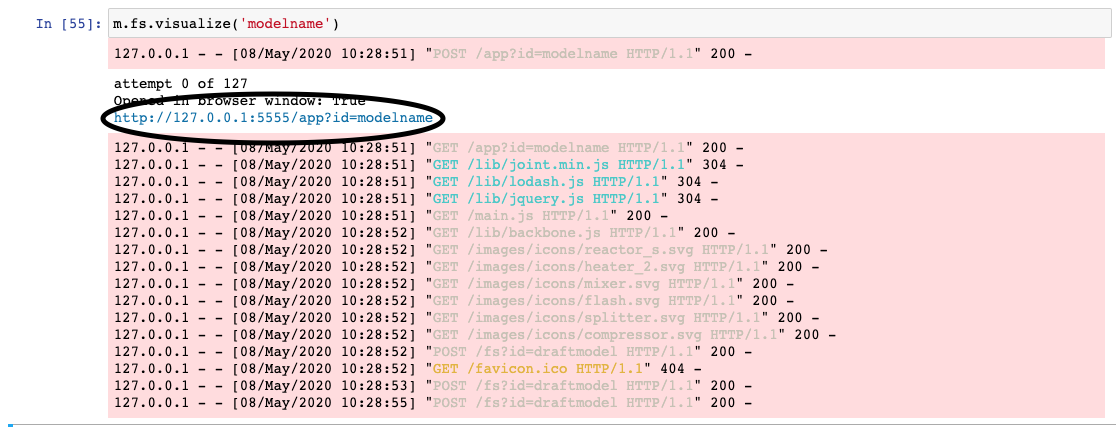
- Call visualize from the flowsheet with a model name as a string. m.fs.visualize(‘model_name’)

- A webpage should display.
If a webpage does not display then copy and paste the URL that outputs from the visualize command.
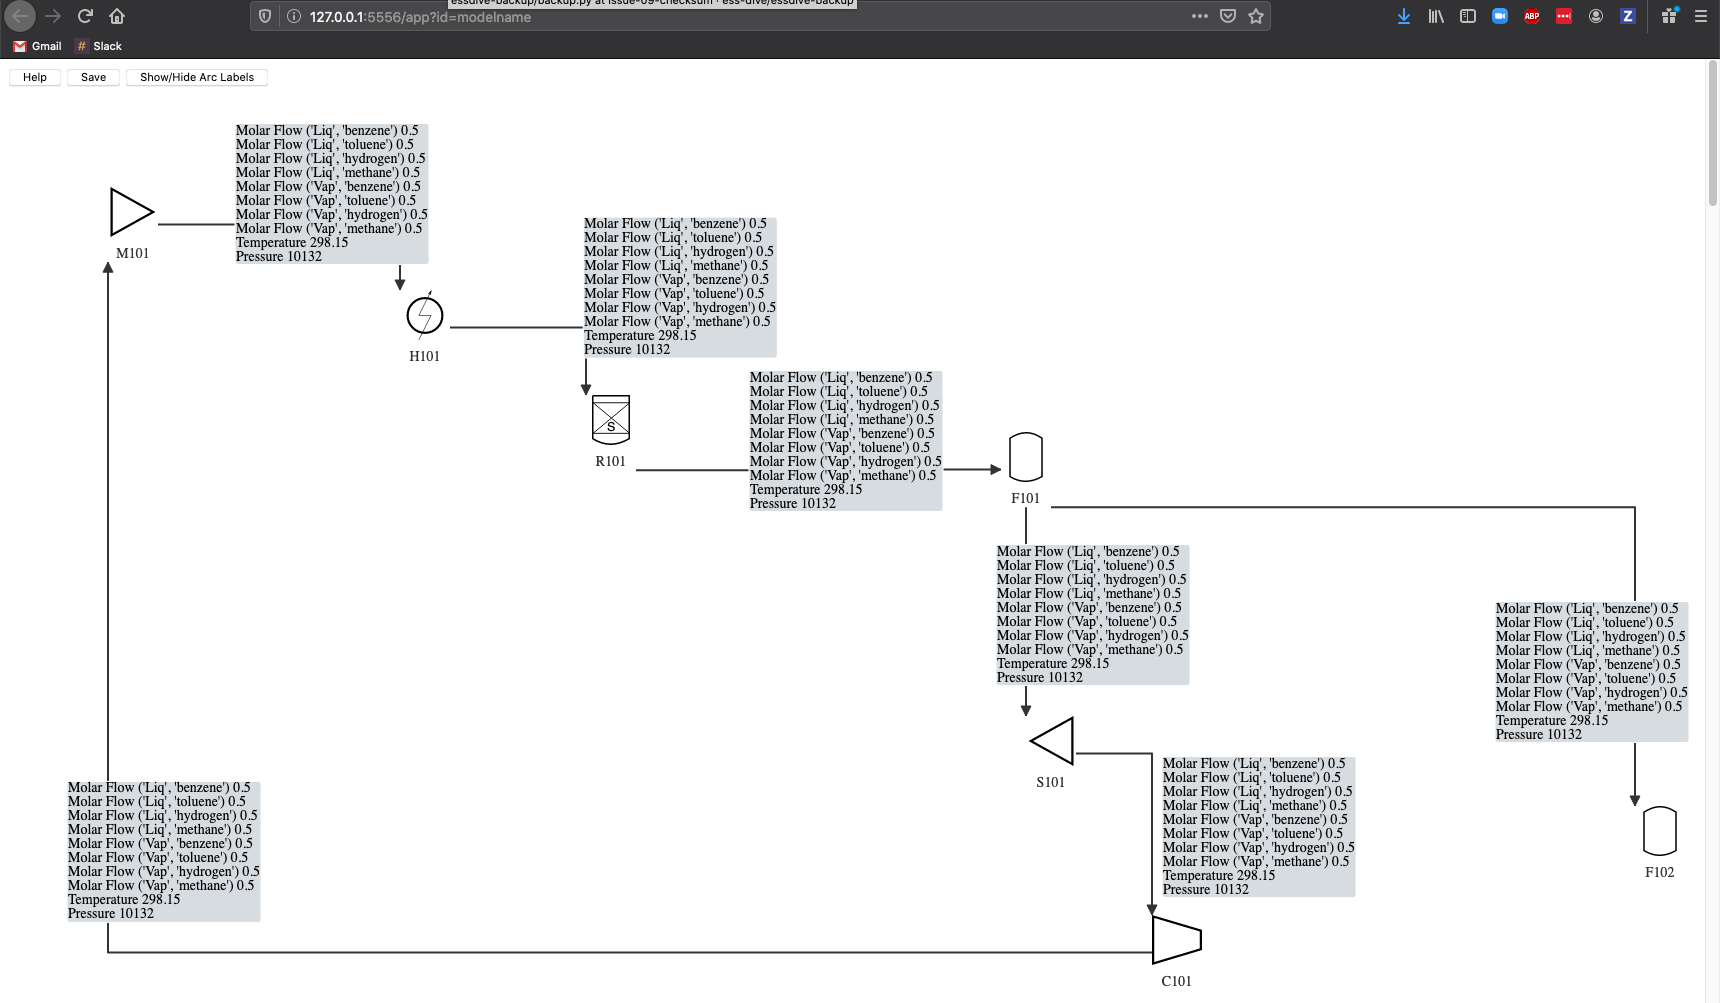
- Modify the layout of the model
- Modify the model if needed
- Call visualize from the flowsheet with a model name as a string. m.fs.visualize(‘model_name’)
- A new webpage should display with the model. If the only changes to the model are to the labels then the layout should be entirely preserved. If there is a new unit model then the existing model is partially preserved and the new unit model and arcs will appear in a diagonal line.
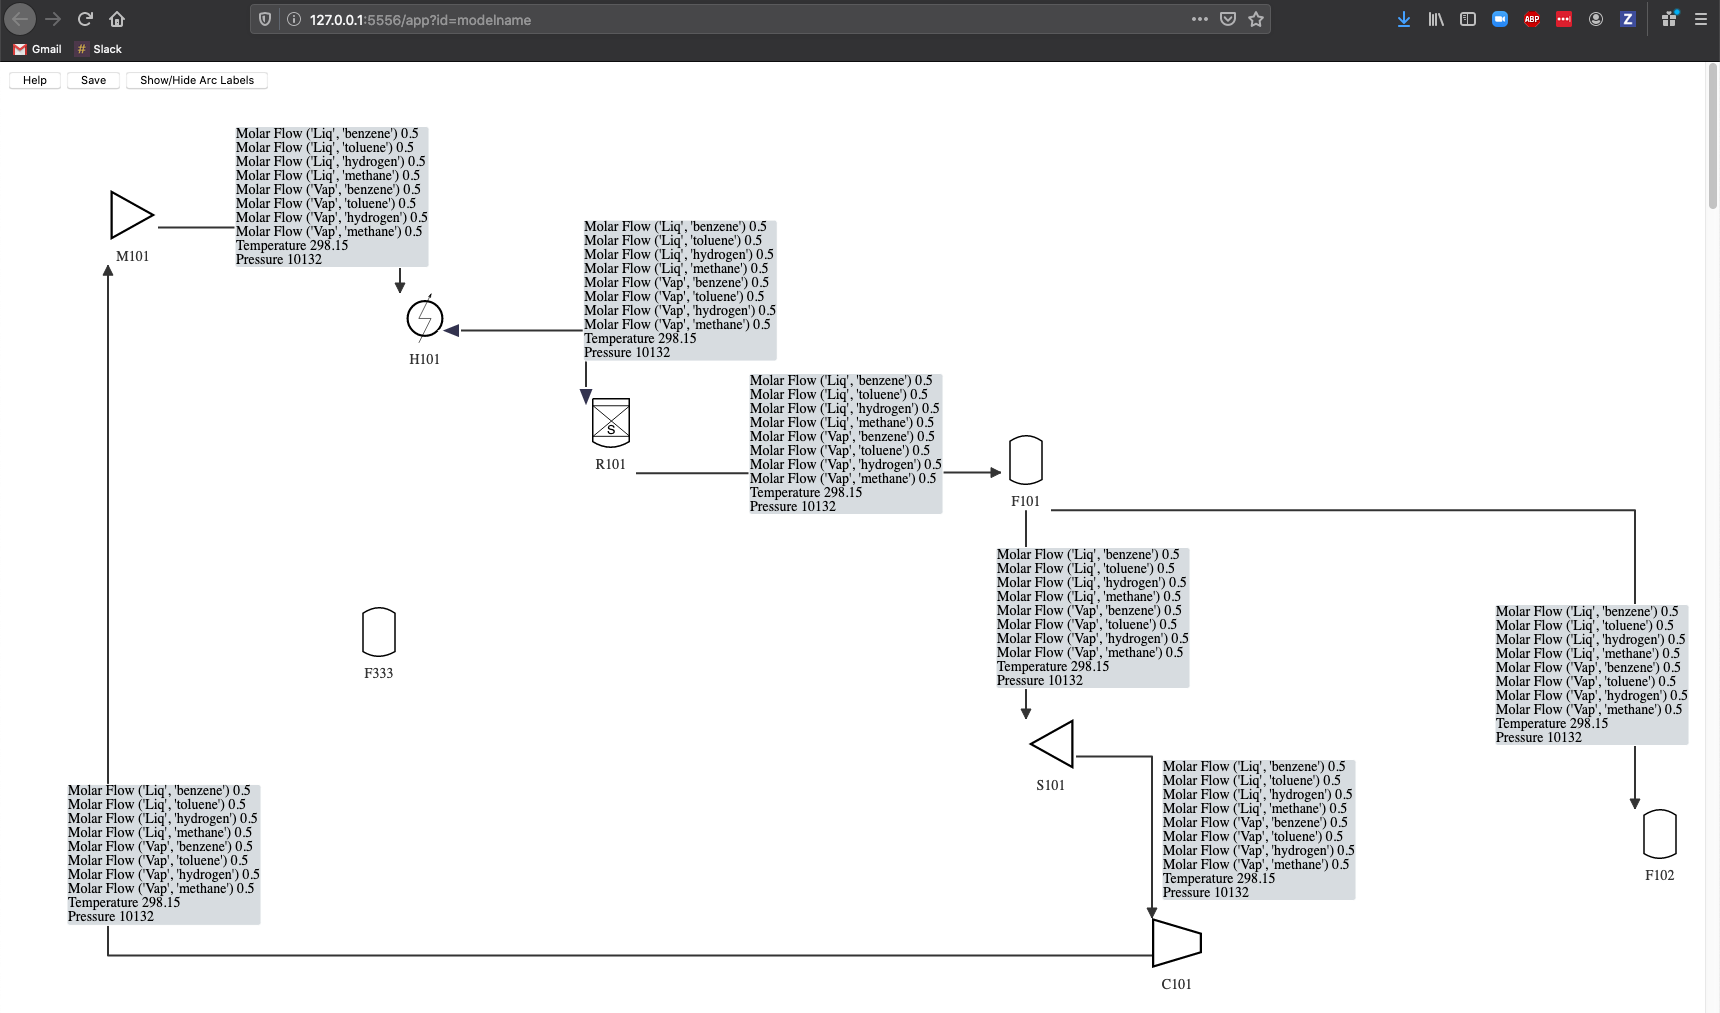
- Modify the model layout for any new unit models if needed
- Repeat steps 5 though 8 as necessary
- Save the model to a file