Visualization
Warning
The visualization tool is still in active development and we hope to improve on it in future releases. Please use its functionality at your own discretion.
Overview
The Flowsheet Visualizer is a service that starts a flask server to display an interactive webpage with the current flowsheet’s unit models and arcs. Users may manipulate the display by clicking and dragging the unit models, streams, and stream labels.
Installation instructions
Usage
- Create a flowsheet in a Jupyter Notebook. For the purpose of these instructions the model will be m and the flowsheet will be m.fs
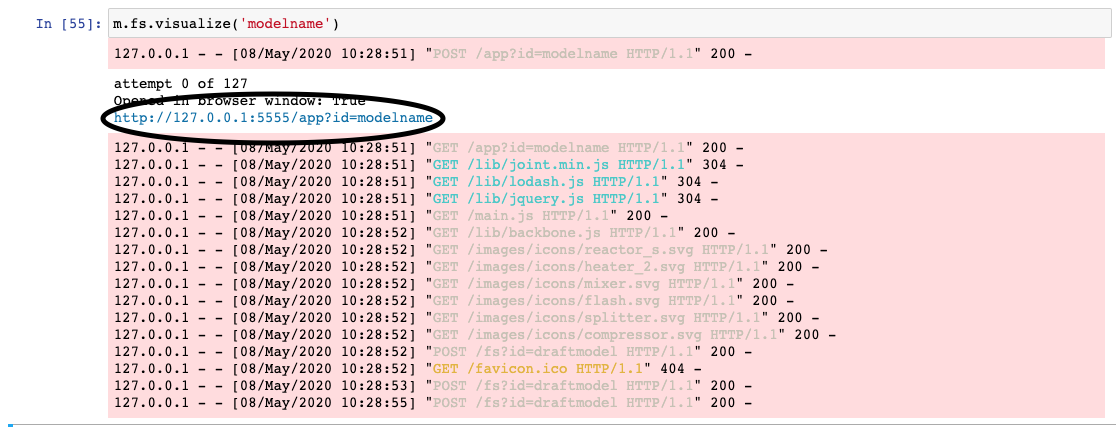
- Call the method visualize() from the flowsheet with a model name as a string: m.fs.visualize(‘model_name’)

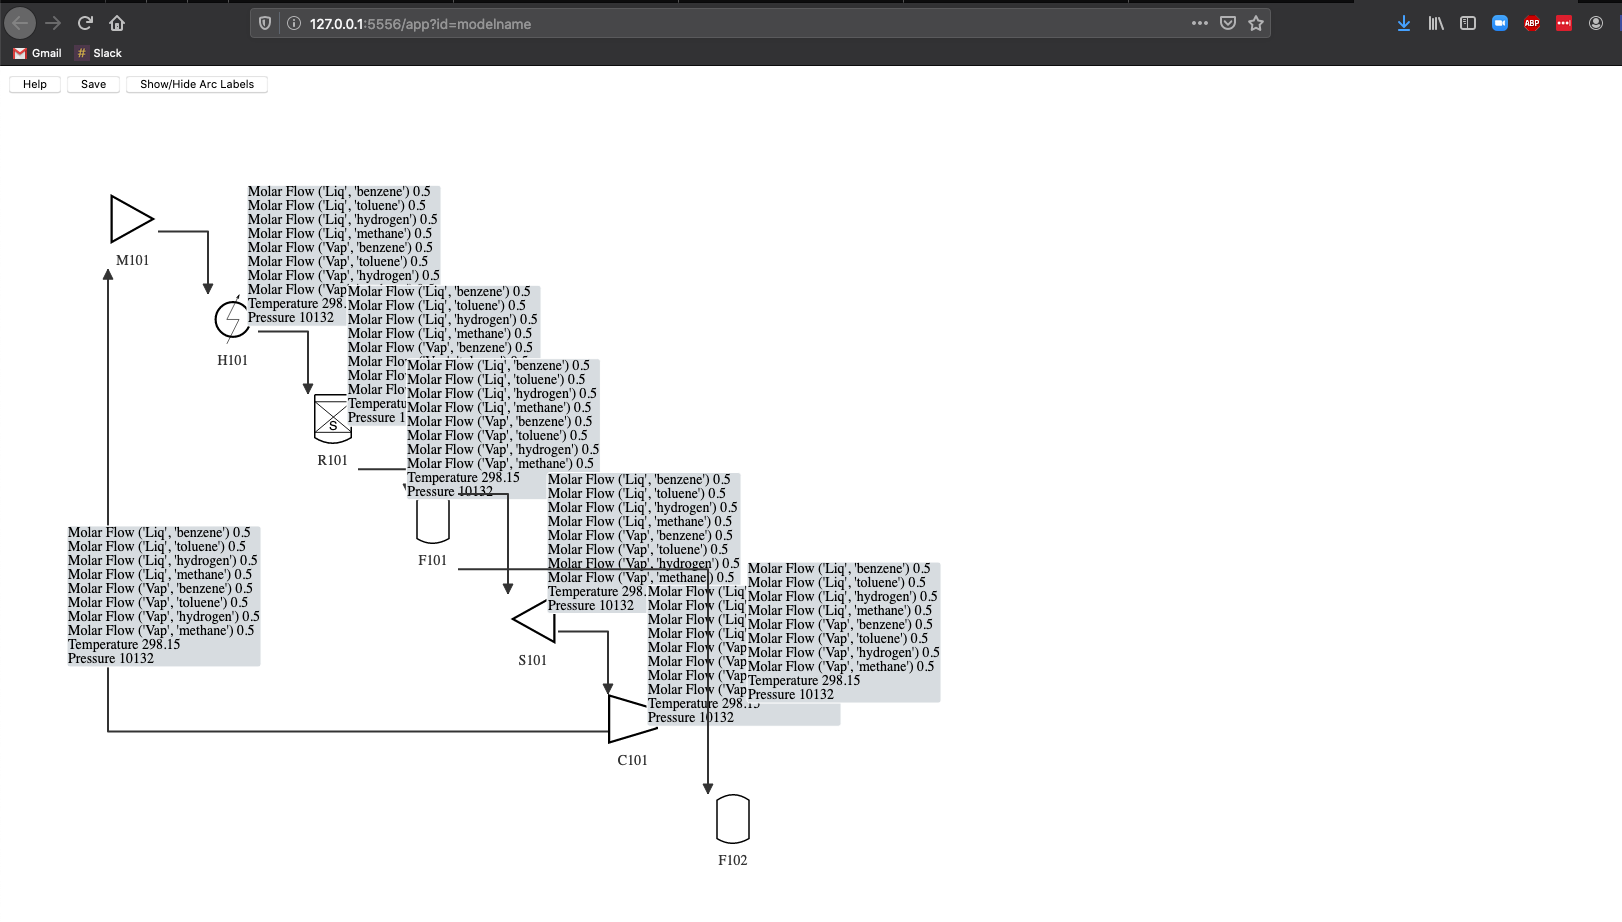
- A webpage should display:
If a webpage does not display then copy and paste the URL that outputs from the visualize command:
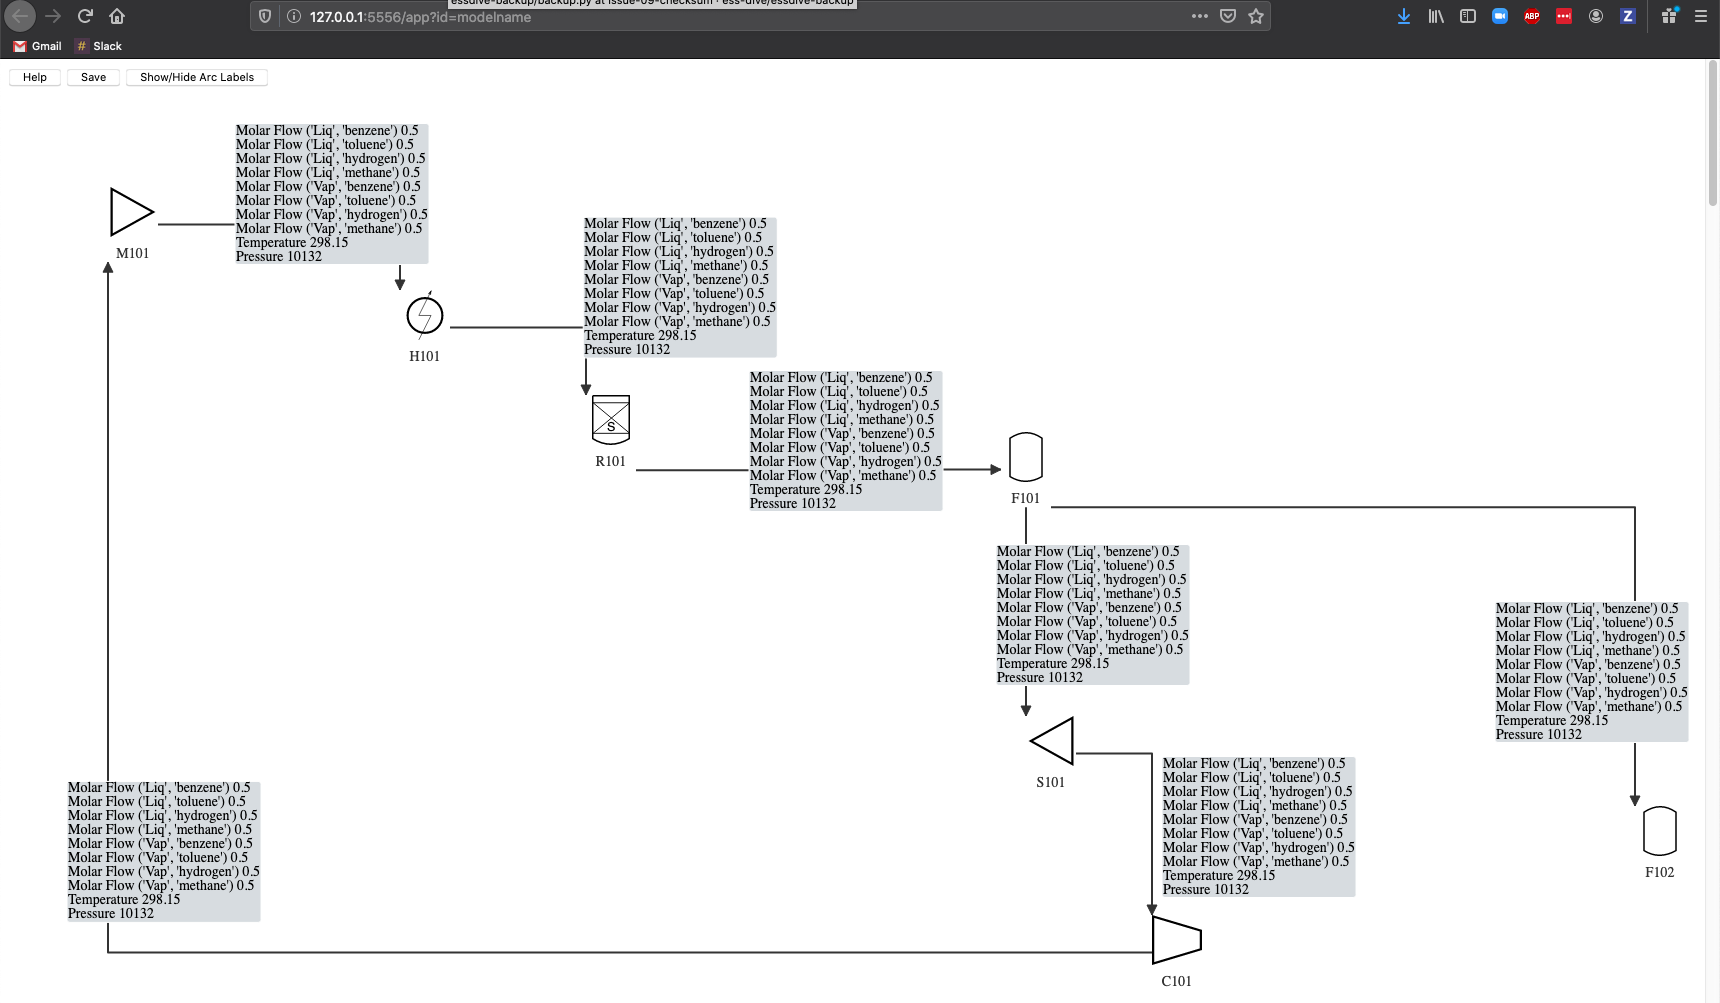
- Manipulate the layout of the model display as desired:
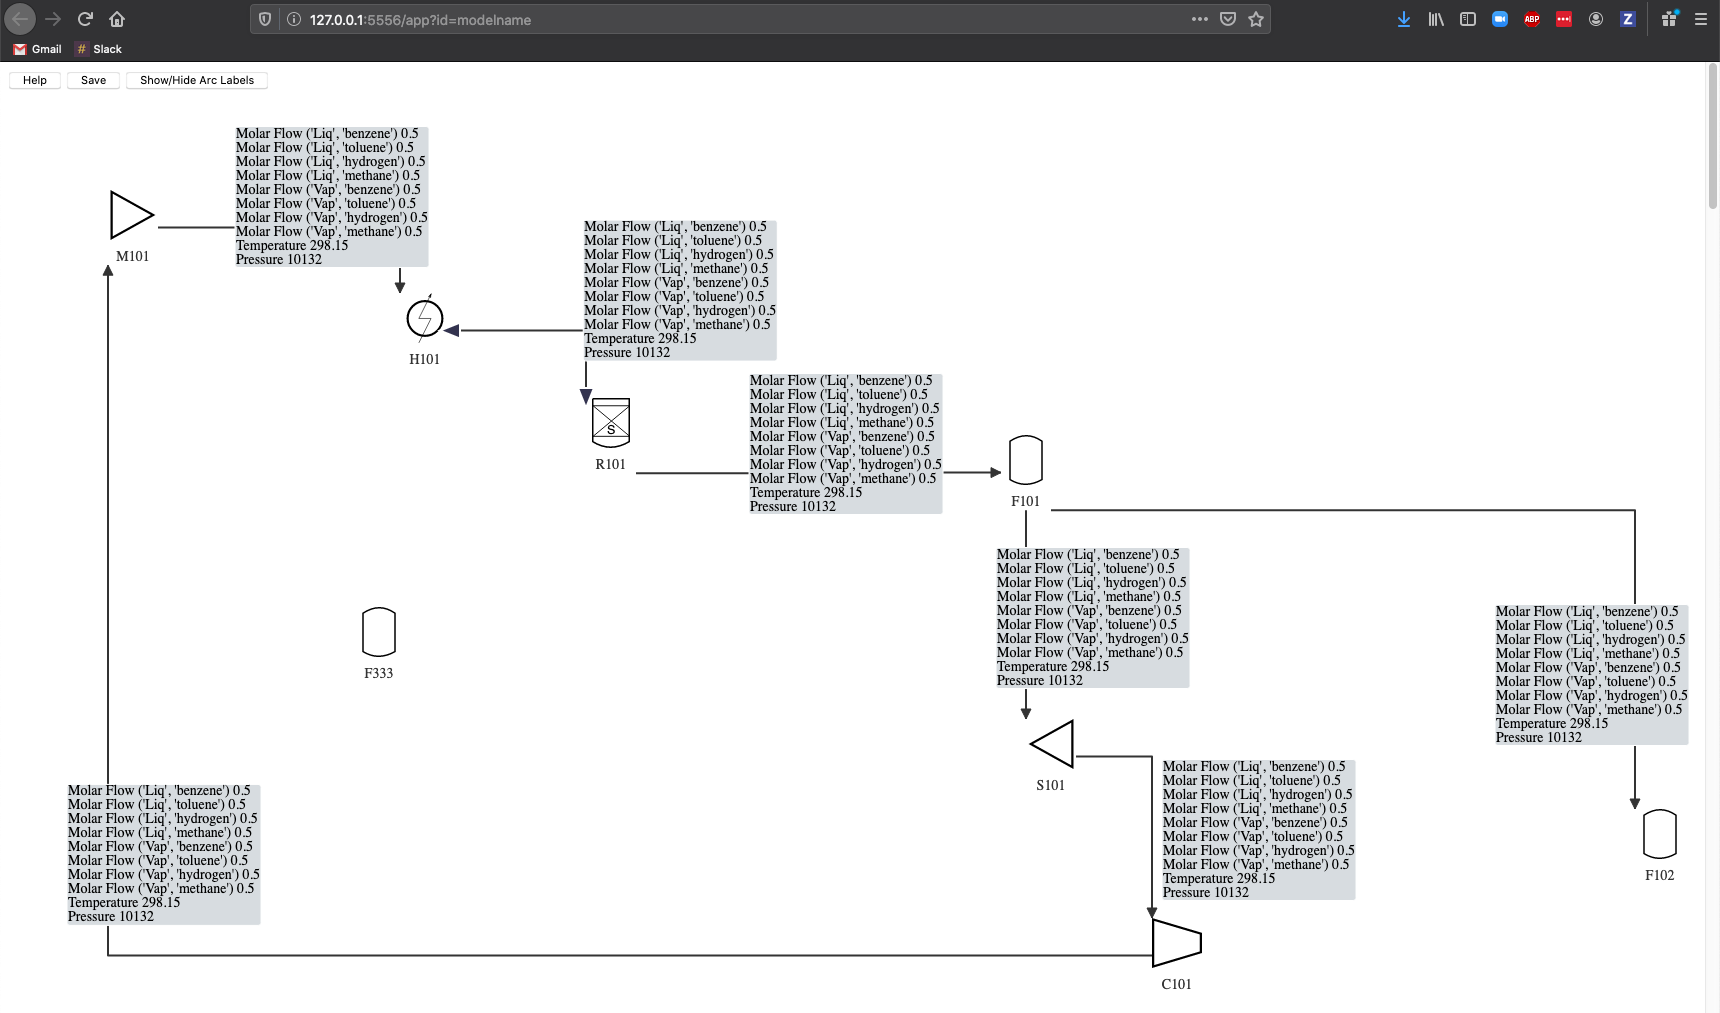
- If the flowsheet is later modified, click the Refresh Graph button to see the changes.
The displayed layout is preserved as much as possible, with new components appearing along a diagonal line.
Note
This feature is still under development. Several types of changes to the flowsheet currently cause the entire user- modified layout to be lost. Consider saving the layout often (see below).
- Save the displayed layout using the save button on the visualization page. This writes the visualization to a file in the user’s home directory under .idaes/viz using the model name provided to visualize(). In this example the filename would be model_name.viz.
Stream Labels
The initial layout loads with the stream labels hidden. Show or hide all of the stream labels by clicking the button with the speech bubbles, on the toolbar.
Show or hide an individual label by right clicking on the stream or its label.
Misc. Features
- Right click on an icon to rotate it by 90 degrees.
- Create anchor points on a stream by left clicking on the stream. The stream will be forced to connect through each anchor point, typically adding right angles.