IDAES Flowsheet Visualizer
Introduction
The IDAES Flowsheet Visualizer, or IFV for short, is a web-based user interface (UI) that lets you:
View any IDAES flowsheet as a process engineering diagram
Export flowsheet diagrams as images (SVG format)
View and export the “stream table” for the flowsheet
Rearrange the flowsheet diagram to your taste and save the arrangement for next time
Dynamically refresh the displayed values to reflect changes in the underlying IDAES model
To use the IFV, first install IDAES. The IFV can be invoked from a Jupyter Notebook or a Python script. It does not require that you run any other application. Currently the IFV is only for viewing the flowsheet on your own computer. 1
Starting and stopping the IFV is fast and does not consume many resources.
1 But, since it is a web application, a shared service for viewing flowsheets stored remotely is definitely possible.
Guide
This guide describes how to invoke (i.e., start) and use the IFV.
Invocation
The IFV visualizes flowsheets. To get started with creating a flowsheet with IDAES, see the Flowsheet models documentation page. Once you have created your flowsheet, simply call the visualize method on that object, passing some parameters to give it a name and optional file for saving changes:
# First, create your IDAES model, "m", which has an attribute ".fs" for the flowsheet
# Then, invoke the `visualize` method
m.fs.visualize("My Flowsheet", save_as="my_flowsheet.json")
The invocation of the visualize method will pop up a browser tab or window with the UI, displaying the flowsheet and, if the information is available, the stream table. In the notebook or script, you can continue to run more code and the UI will continue to work in the background. You can close the UI at any time. If you exit the script or notebook while the UI is running, you can still manipulate the diagram and stream table, but you will not be able to save or refresh, since these require communication with the Python process that no longer exists.
There are three ways to invoke the visualize functionality, which in the end do the same thing and have the same arguments.
Use the visualize method of a flowsheet (as above)
Call the visualize function from the package idaes.ui.fsvis, passing it a flowsheet object
Call the same visualize function from the module idaes.ui.fsvis.fsvis, passing it a flowsheet object
In all cases, the arguments and behavior are the same. See the visualize function documentation for details on parameters to this function.
Note
You can continue to modify and use your model and flowsheet after calling visualize(). This may update the visualization, but nothing you do in the IFV will affect the Python model; it is read-only.
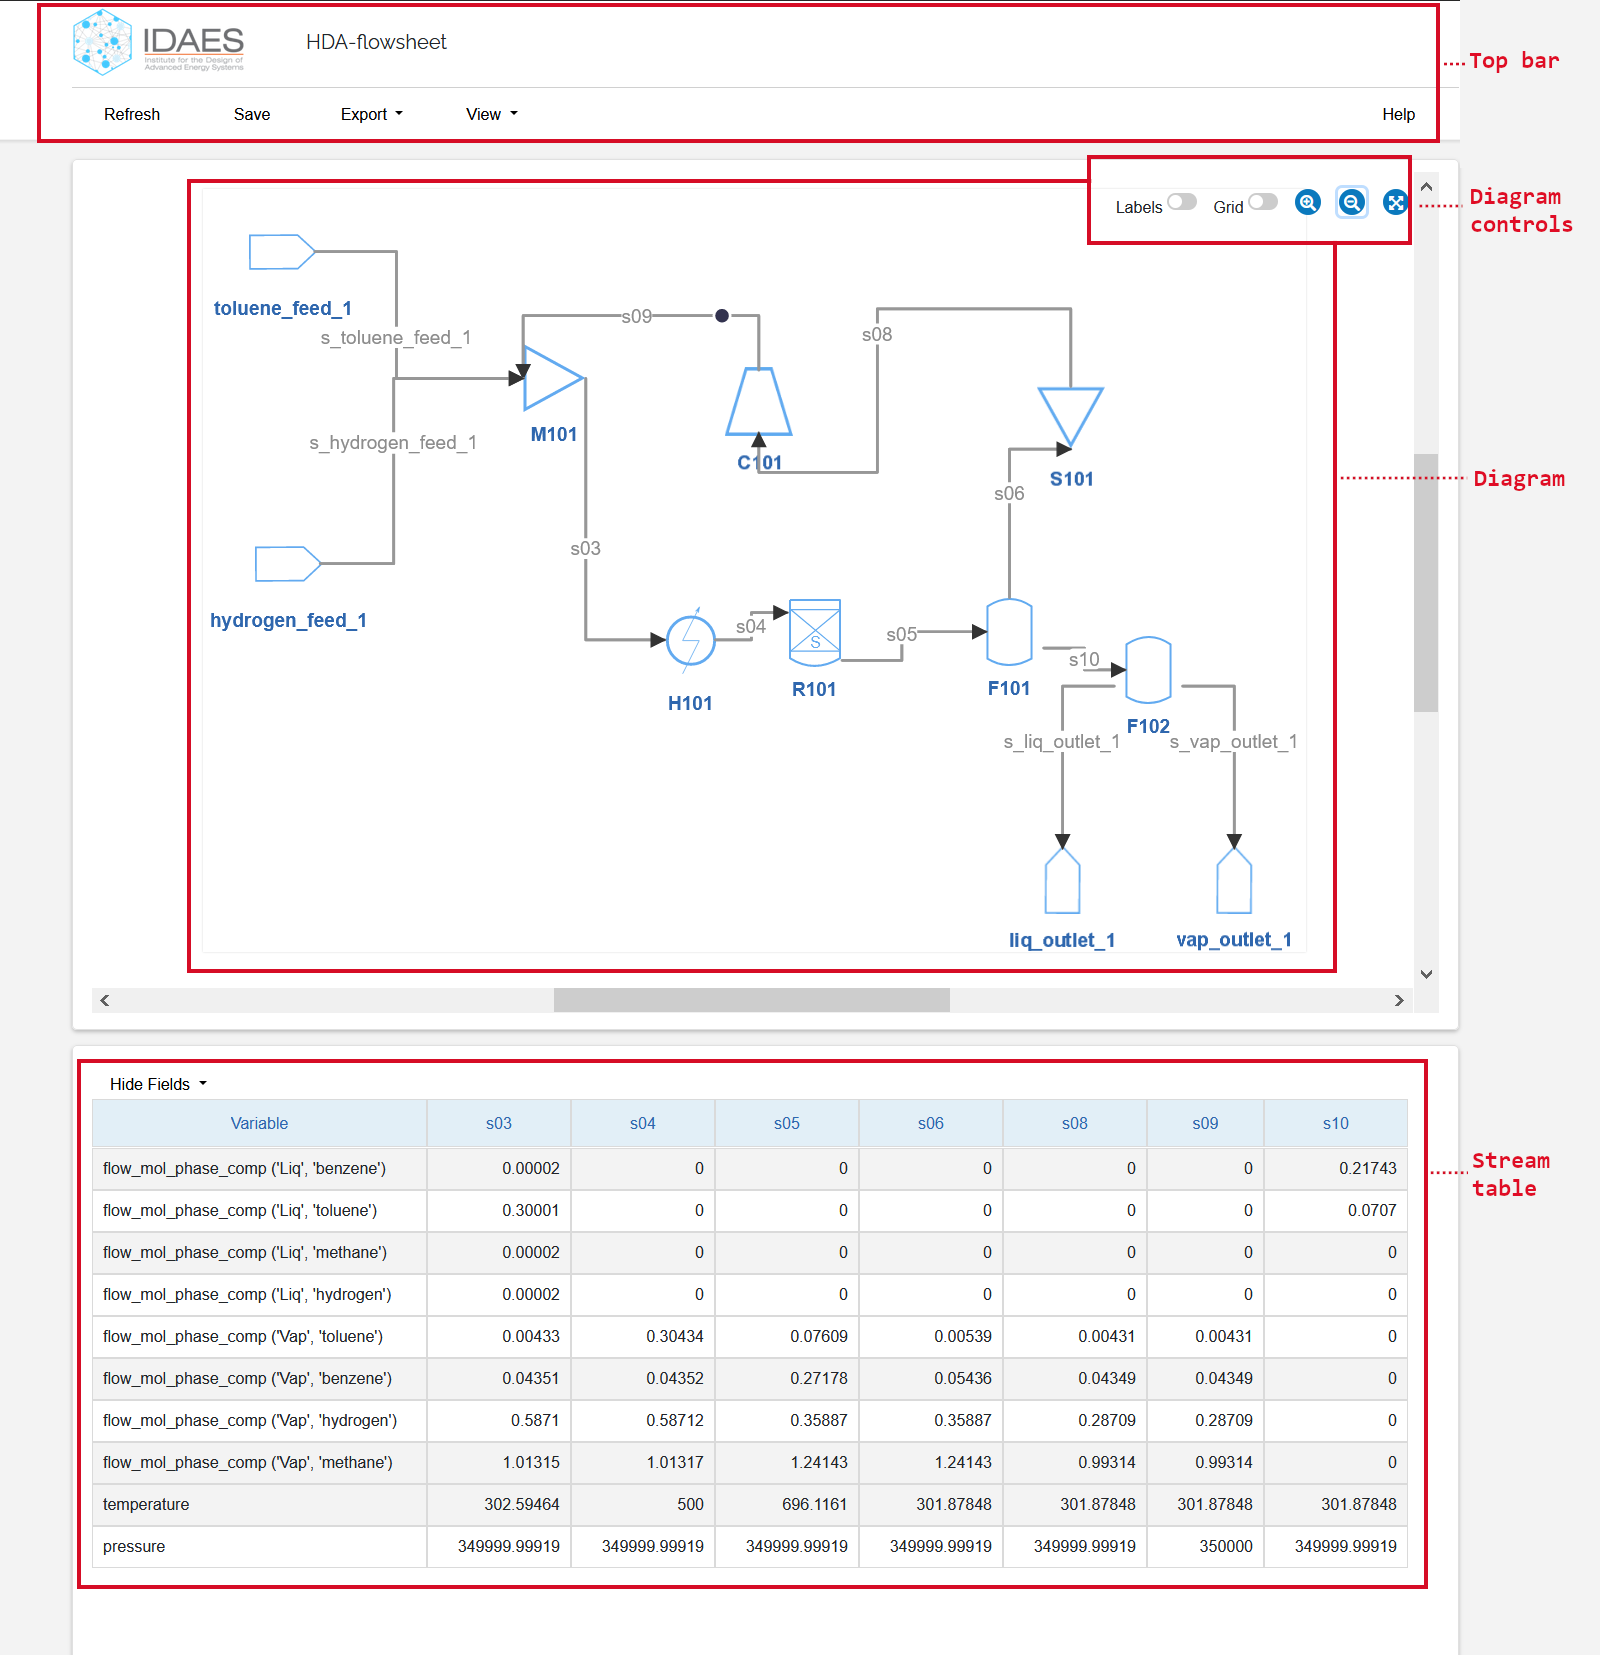
User Interface
This section describes how to use the graphical web user interface. We start with a screenshot of the UI, with the main areas highlighted. Then we zoom in on each area and describe how to use it.
In the screenshot of the IFV UI below, you can click on one of the indicated areas to jump to the associated description.
Top bar
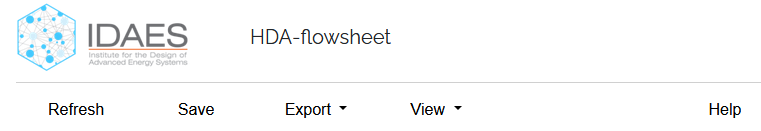
Screenshot of the top bar of the IFV UI
The top bar has a title bar, which contains the IDAES logo and the name of the flowsheet being visualized, and a menu. The menu items are:
Diagram
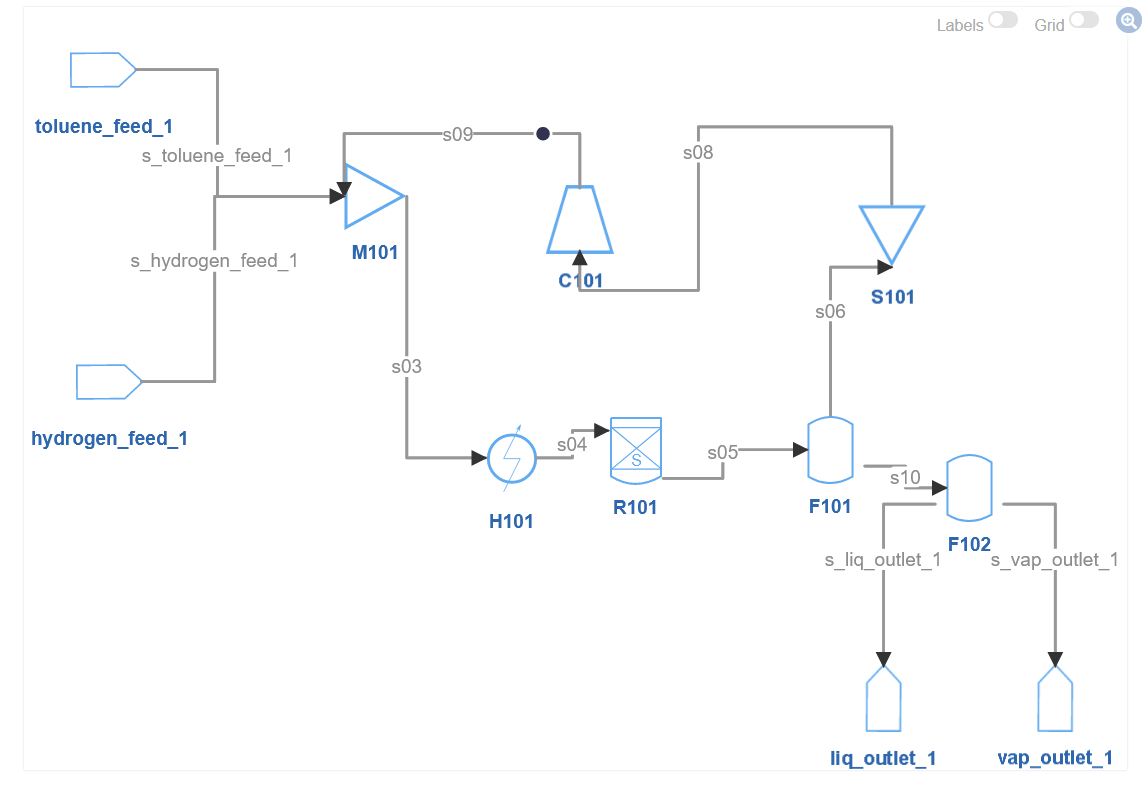
Screenshot of the main diagram (or flowsheet) area of the IFV UI
The diagram (or flowsheet) area lets you rearrange the flowsheet as you need and zoom in on particular sections. You can interact with the components on the diagram:
- Shapes
Geometric shapes on the flowsheet represent unit models, inlets and outlets, and other IDAES components. They are connected by lines, and each has a name. All shapes can be moved by clicking and dragging them. If you right-click on a shape, it will rotate 90 degrees.
- Lines
The lines connecting units can be manipulated by clicking and dragging. You can click on a line to create a new segment that can be used for routing the line around objects. You can eliminate a segment by clicking on the dot that appears as you hover over the line. There are also pill-shaped handles that appear on the lines for moving them. The endpoints of the lines are determined by the flowsheet and cannot be changed. For the same reason, you also cannot add or remove lines.
- Labels
Both the shapes and lines have associated values that can be shown, which pop up over the lines if you toggle the “Show labels” control. See the Diagram Controls section for details.
More details on mouse and keyboard actions for the diagram are available in the documentation of the underlying Rappid toolkit.
Diagram Controls
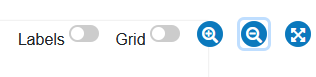
Screenshot of the diagram controls area of the IFV UI
The diagram controls allow you to affect some global properties of the diagram/flowsheet area.
- View actions
Labels: Toggle visibility of the information (labels) shown for each stream. This is the same information that appears in the Stream Table.
Grid: Toggle a background “grid”
 : Zoom in by 25%
 : Zoom out by 25%
 : Fit the diagram into the current area
Stream Table
The IFV will show a stream table with variables defined for each stream in the flowsheet, if these values exist and the flowsheet adheres to the IDAES conventions for naming the inlet and outlet streams. An example of a stream table is shown below.
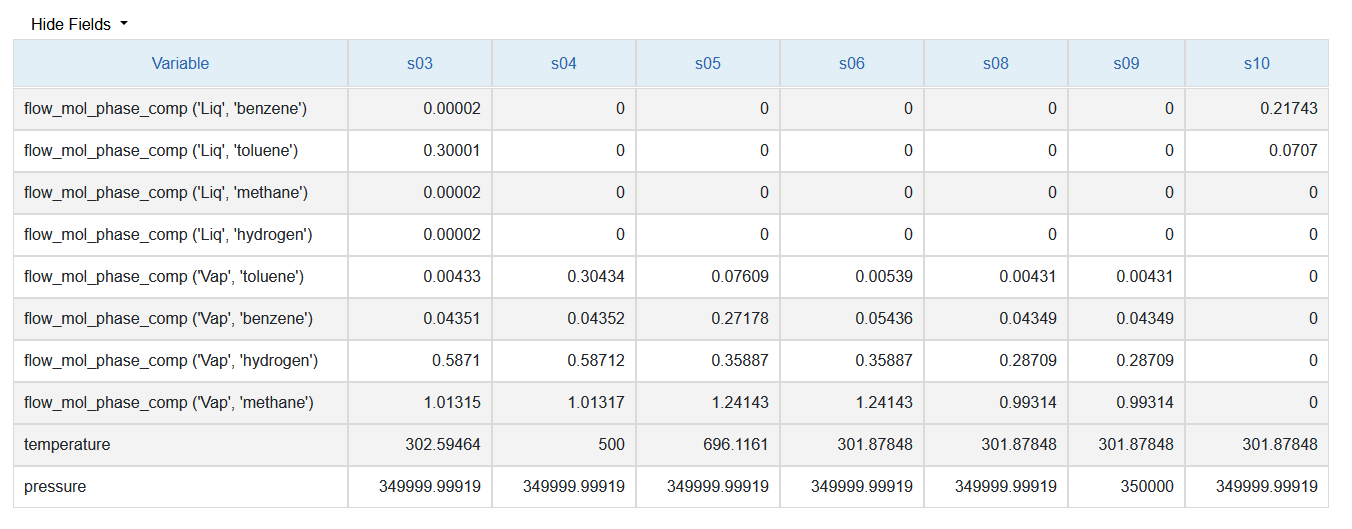
Screenshot of an example stream table
There are a number of ways of manipulating this table:
The “Hide Fields” pull-down menu provides a list of stream names. Select a name to hide/show that column in the table.
Click on the column header and drag it left or right to change its order in the table.
Resize a column by hovering over a column border until you see the mouse pointer change, then drag it to resize.
You can also export the entire table as a file of comma-separated values. See the Export documentation for details.
Reference
-
idaes.ui.fsvis.fsvis.visualize(flowsheet, name: str = 'flowsheet', save_as=None, browser: bool = True, port: Optional[int] = None, log_level: int = 30, quiet: bool = False) → int[source]¶ Visualize the flowsheet in a web application.
The web application is started in a separate thread and this function returns immediately.
Also open a browser window to display the visualization app. The URL is also printed (unless
quietis True).Note: The visualization server runs in its own thread. If the program that it is running in stops, the visualization UI will not be able to save or refresh its view. This is not an issue in a REPL like the Python console, IPython, or Jupyter Notebook, since these all run until the user explicitly closes them. But if you are running from a script, you need to do something to avoid having the program exit after the visualize() method returns (which happens very quickly). For example, loop forever in a try/catch clause that will handle KeyboardInterrupt exceptions:
# Example code for a script, to keep program running after starting visualize() thread
my_model.fs.visualize()  # this returns immediately
try:
    print("Type ^C to stop the program")
    while True:
        time.sleep(1)
except KeyboardInterrupt:
    print("Program stopped")
- Parameters
flowsheet – IDAES flowsheet to visualize
name – Name of flowsheet to display as the title of the visualization
save_as – If a string or path then save to a file.
browser – If true, open a browser
port – Start listening on this port. If not given, find an open port.
log_level – An IDAES logging level, which is a superset of the built-in
loggingmodule levels. Seeidaes.loggerfor detailsquiet – If True, suppress printing any messages to standard output (console)
- Returns
Port number where server is listening
- Raises
ValueError – if the data storage at ‘save_as’ can’t be opened
Software notes
This section provides some additional details for developers or users more interested in the programming details.
Client/server architecture
The visualize() command works by starting an HTTP server in a separate thread, and serving
requests from the UI (or any other requester). The server only responds to requests from your computer,
not the internet. When you exit the script or Jupyter Notebook that called visualize then you will also
stop the server – and the associated IFV page will no longer be able to save or refresh the flowsheet.
The architecture diagram is shown below.
+-------------------+                        +--------------------+
|                   |                        |    Web browser     |
|  'Python script'  |                        +--------------------+
|  'or Jupyter'     |    +---------------+   | IFV web interface  |
|  'Notebook'       |    | 'HTTP server' |   +--------------------+
|                   |    | 'running in'  |   |    +--+            |
|                   |    | 'a separate'  |   |    +--+            |
|                   |    | 'thread'      |   |      |      +--+   |
|                   |    |               <--->      +----> +--+   |
|  m.fs.visualize   +---->  Load/Save    |   |                    |
|                   |    |               |   |                    |
+-------------------+    +-----^---------+   +--------------------+
                               |
                               |
                        +------v--------------+
                        |   Local Storage     |
                        +---------------------+
Persistence architecture
The saving of the model uses the the module idaes.ui.fsvis.persist.
This module implements the well-known “factory pattern”, which makes it easy to extend by adding
a new DataStore sub-class and updating the logic in the factory method,
create(), to create and return instances of that class for a given input type.
The input in this case comes from the save_as argument to the visualize() method.