Visualizing Surrogate Model Results#
The idaes.core.surrogate.plotting.sm_plotter module contains a number of methods to assess the accuracy and performance of a surrogate model fit. Once a surrogate model is trained by an external tool (e.g. ALAMO, PySMO, TensorFlow Keras), the present methods automatically visualize results from passed surrogates and process data. Note that these methods are intended for surrogate model visualization, and users must pass an IDAES Surrogate object and a pandas DataFrame as required inputs. The methods will handle residual calculation, surrogate evaluation and plot formatting for the user.
For detailed examples on integrating IDAES surrogate visualization methods with the IDAES Surrogates API, see https://idaes.github.io/examples-pse/latest/Examples/SurrMod/FlowsheetOptimization.
idaes.core.surrogate.plotting.sm_plotter contains four utility methods for plotting and formatting data:
sm_plotter.surrogate_scatter2D - generate 2D scatter plots for each predicted input/output combination overlaid with validation data
sm_plotter.surrogate_scatter3D - generate 3D scatter plots for each predicted (input1, input2)/output combination overlaid with validation data
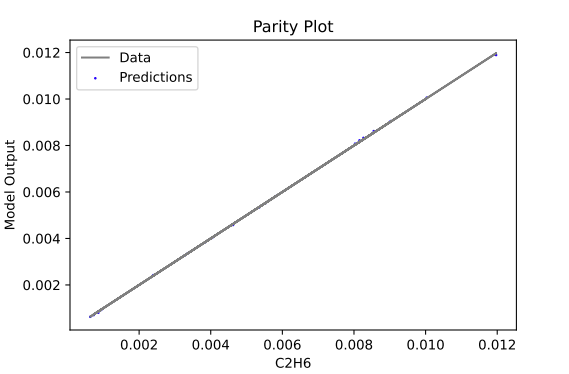
sm_plotter.surrogate_parity - generate parity plots for each data output/predicted output
sm_plotter.surrogate_residual - generate residual (error) plots for each predicted input/output combination
Dependencies#
In addition to built-in Python functions, the visualization methods depend on the following packages:
numpy - numerical calculations and internal data reshaping
matplotlib.pyplot - general plot generation
matplotlib.backends.backend_pdf - writes plots to a PDF results file
itertools.combinations - utilized to iterate over all (input1, input2) combinations for surrogate_scatter3D
Basic Usage#
To use the packages, they must be imported from idaes.core.surrogate.plotting.sm_plotter and required arguments must be defined as in the example script below:
# Required imports
>>> import numpy as np
>>> import pandas as pd
>>> from idaes.core.surrogate.sampling.data_utils import split_training_validation
>>> from idaes.core.surrogate.plotting.sm_plotter import surrogate_scatter2D, surrogate_parity, surrogate_residual

# Load dataset from a csv file
>>> csv_data = pd.read_csv(r'data.csv')  # actual dataset, may be large (e.g. > 2500 data points)
>>> data = csv_data.sample(n = 100)  # if desired, users can randomly sample a smaller subset of data

>>> input_data = data.iloc[:, :2]  # separate out the input variables from the dataset (here, 2 inputs)
>>> output_data = data.iloc[: :2] # the rest of the columns are output variables

>>> input_labels = input_data.columns  # get input data labels from process data
>>> output_labels = output_data.columns  # get output data labels from process data

>>> n_data = data[input_labels[0]].size  # 100 data points
>>> data_training, data_validation = split_training_validation(data, 0.8, seed=n_data)  # if desired, users can split into training/validation datasets

# Create IDAES Surrogate model (not shown here - must be AlamoSurrogate, PySMOSurrogate or KerasSurrogate object)
# users can train surrogates using IDAES ALAMO, PySMO, or TensorFlow Keras tools on data_training

# Call visualization methods on surrogate object and validation data
>>> surrogate_scatter2D(surrogate, data_validation, filename='scatter2D.pdf', show=True)
>>> surrogate_scatter2D(surrogate, data_validation, filename='scatter3D.pdf', show=True)
>>> surrogate_parity(surrogate, data_validation, filename='parity.pdf', show=True)
>>> surrogate_residual(surrogate, data_validation, filename='residual.pdf', show=True)
surrogate is an IDAES Surrogate object containing serialized surrogate data, model information, variable labels and surrogate expressions
data_validation is a two-dimensional Pandas DataFrame array containing input data for predictions and output data for results comparison
Optional Arguments
filename (default = None) provides a PDF file path/name to write results plots in a single file per method run; the methods will overwrite any existing files with the passed file name, and will not write files if no argument is provided
show (default = True) tells the methods whether to display the produced plots in an available viewer window, console or other results panel; pass False to suppress plot output
An example of a plot that is produced:
Available Methods#
Standard plotting methods (scatter, parity and residual plots).
Author: B. Paul